Improved Feature: Updated Look to Process Rule Analytics
Previous state: Process rule analytics used the previous layout which only showed rule triggers and triggered records.
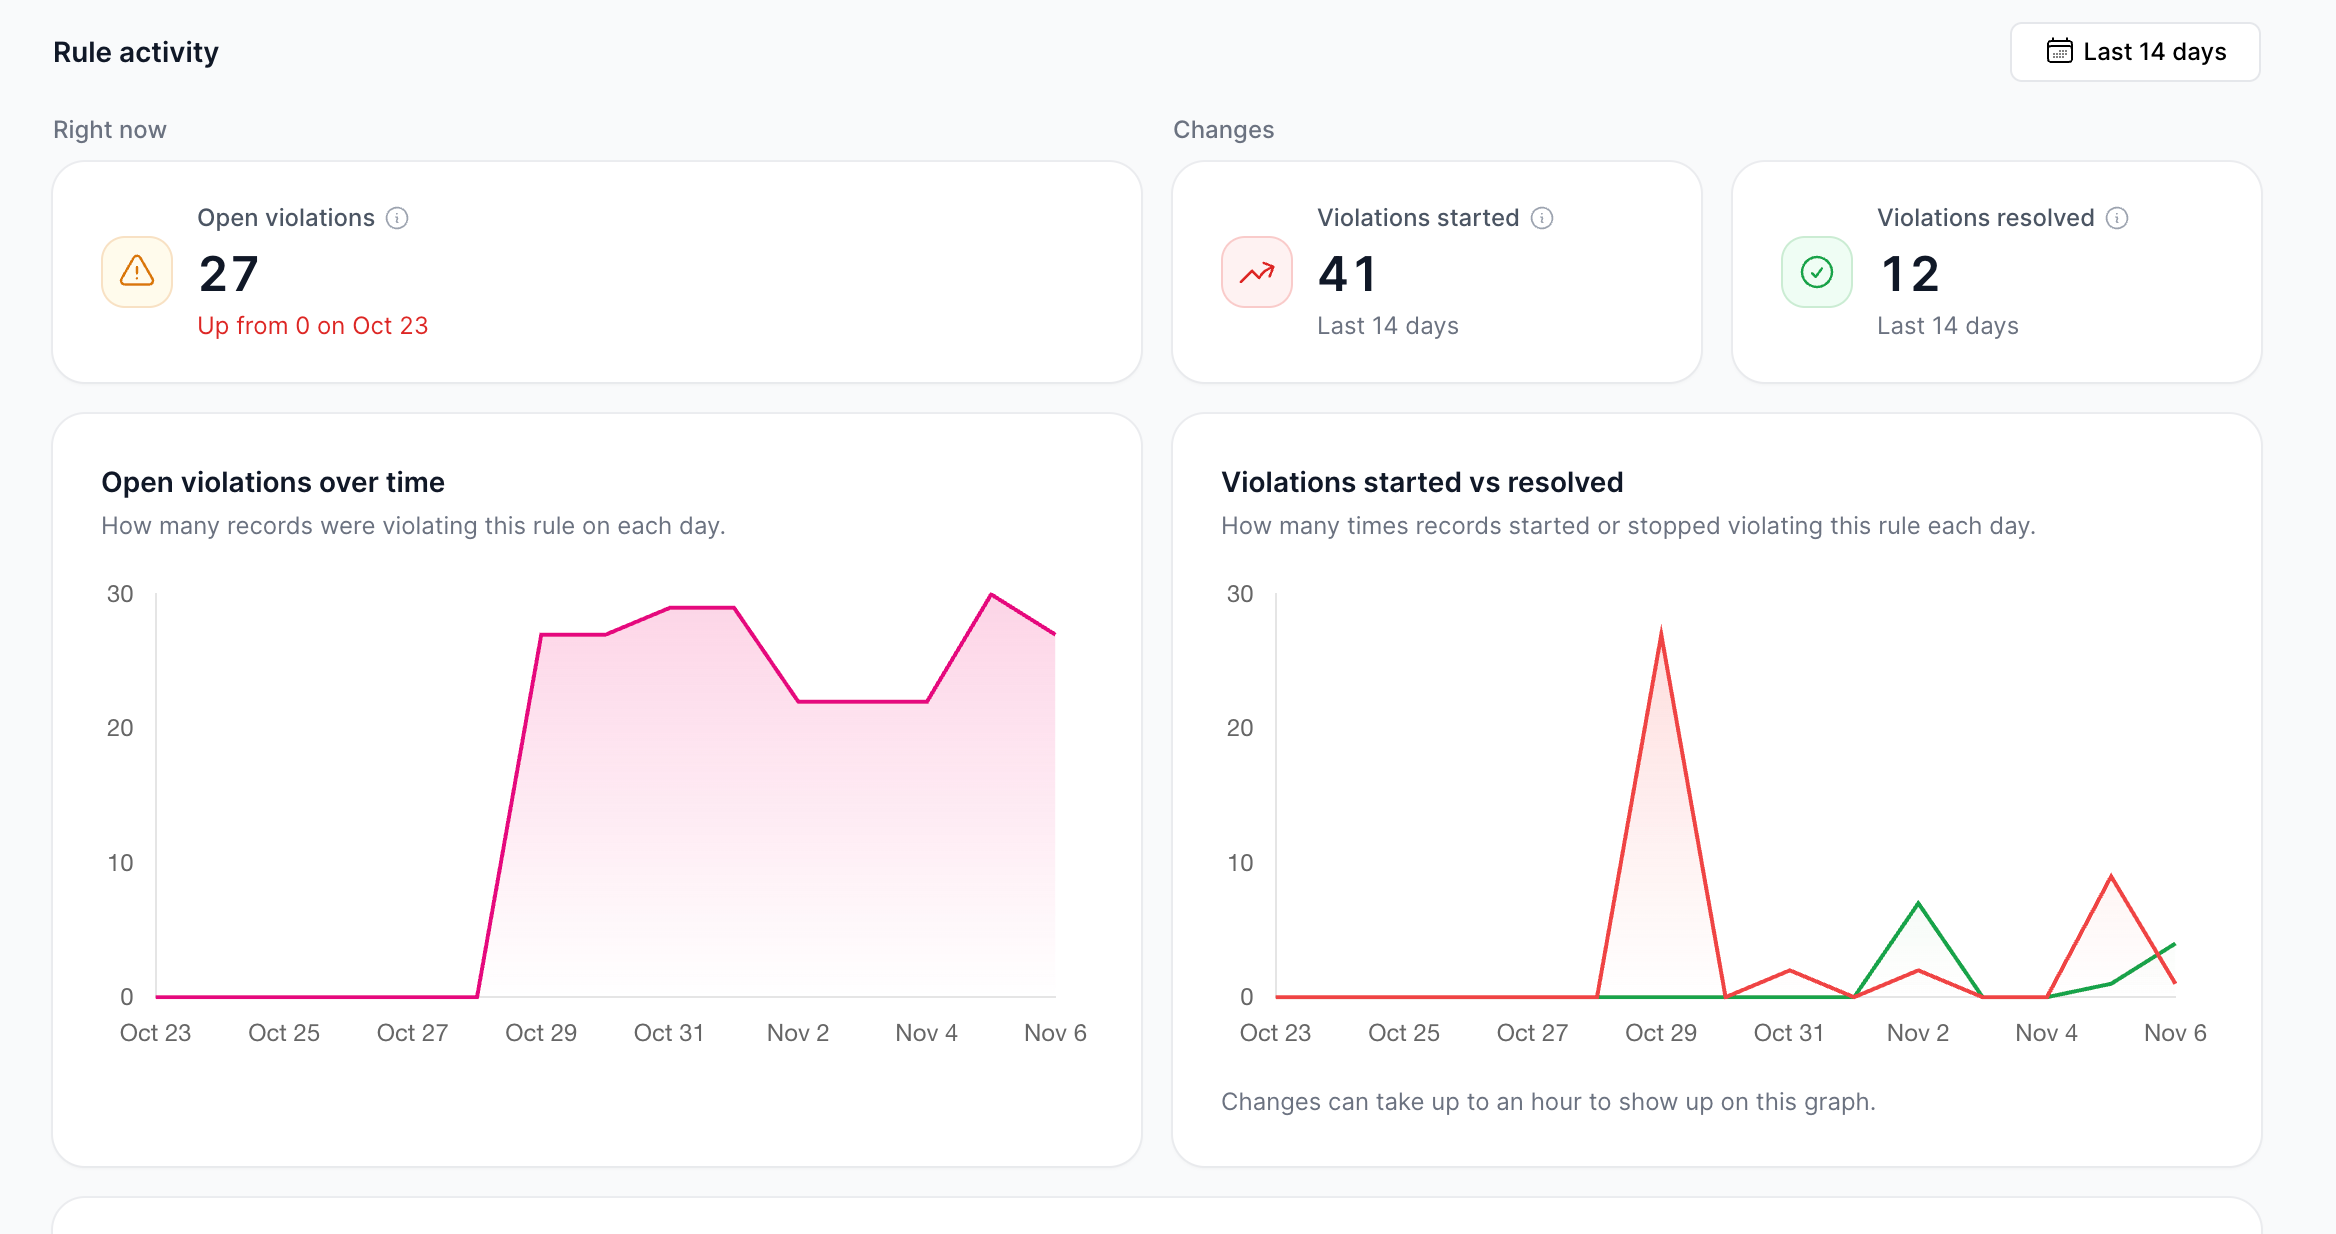
Improved state: The process rule activity view has a redesigned layout with more analytics and content to help see improvements or backslides in productivity and rule triggers.
Right now activity:
Open violations: Records breaking this rule right now, compared with the first day on the graph.
Open violations over time: How many records were violating this rule on each day.
Changes in activity:
Violations started: How many times a record started violating this rule in this period. A record that violates it again, counts again.
Violations resolved: How many times a record stopped violating this rule in this period. A record resolved more than once, counts each time.
Violations started vs resolved: How many times records started or stopped violating this rule each day.
Changes can take up to an hour to show up on the graphs.
Benefits
See current violations and recent changes at a glance.
Spot trends in rule violations over time.
Clearer charts and labels make the data easier to read.